
 Italiano
 Français
 Deutsch
 Español
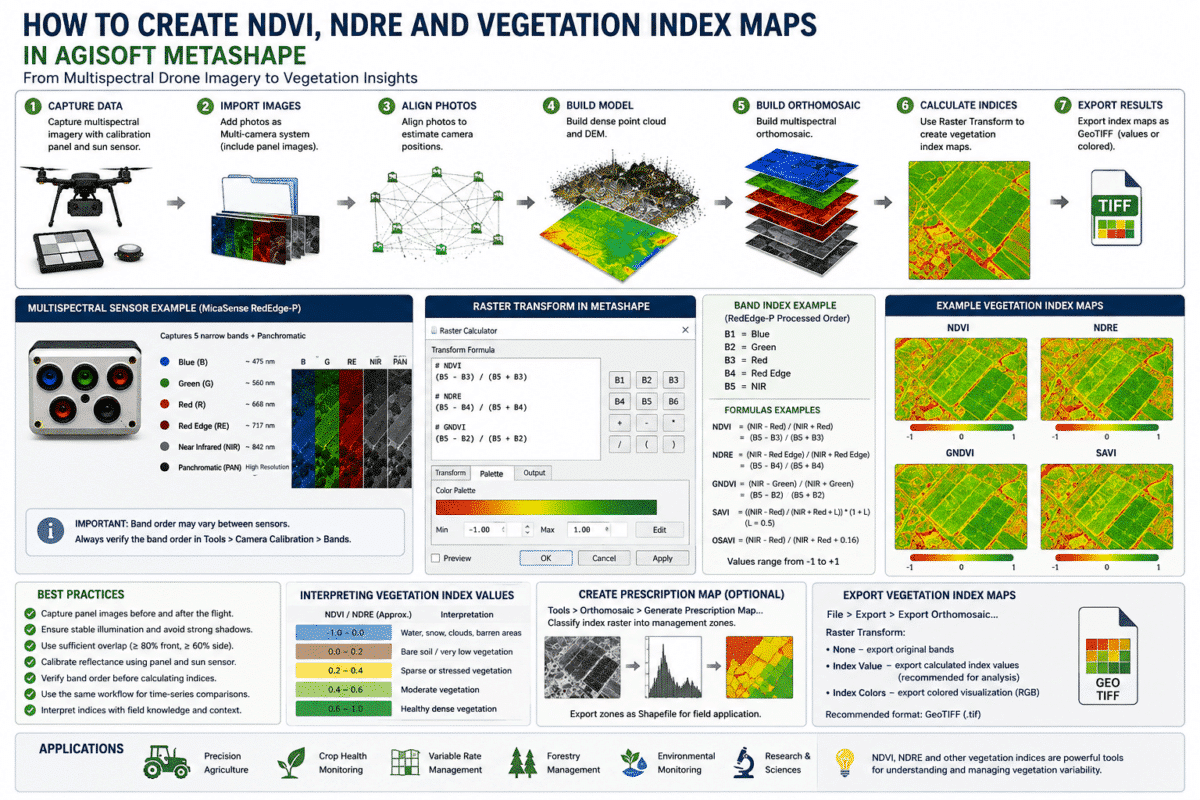
Creating NDVI, NDRE and other vegetation index maps in Agisoft Metashape allows drone operators, agronomists, researchers and environmental professionals to transform multispectral imagery into meaningful information about vegetation variability.
When images are captured with a multispectral sensor containing Red, Green, Red Edge and Near Infrared (NIR) bands, Metashape Professional can process the complete photogrammetric dataset, generate a calibrated multiband orthomosaic and calculate custom vegetation indices directly inside the software.
Common indices such as NDVI and NDRE can help visualize differences in crop vigor, canopy density and chlorophyll response, while other indices can be selected when soil background, vegetation density or specific wavelengths need greater emphasis.
This guide explains how to create NDVI, NDRE and vegetation index maps in Agisoft Metashape Professional, from reflectance calibration to Raster Transform formulas, color palettes and final GeoTIFF export.
What Is a Vegetation Index?
A vegetation index is a mathematical combination of reflectance values measured in two or more spectral bands.
Healthy vegetation interacts differently with visible and near-infrared light. Chlorophyll strongly absorbs portions of visible light, particularly red wavelengths, while the internal structure of healthy leaves reflects a significant amount of near-infrared energy.
By comparing these spectral responses, vegetation indices can emphasize differences that may be difficult to see in a conventional RGB photograph.
Common applications include:
- Precision agriculture
- Crop monitoring
- Vegetation stress mapping
- Forestry
- Environmental monitoring
- Plant research
- Vineyard and orchard management
- Irrigation analysis
- Canopy variability studies
What Is NDVI?
NDVI stands for Normalized Difference Vegetation Index.
It compares Near Infrared and Red reflectance using the formula:
NDVI = (NIR – Red) / (NIR + Red)
NDVI values theoretically range between -1 and +1.
Vegetation normally produces positive values because healthy leaves reflect more NIR radiation than red light.
NDVI is commonly used for evaluating:
- Vegetation presence
- Relative plant vigor
- Canopy density
- Spatial crop variability
- Changes through time
However, NDVI should not be interpreted as a direct diagnosis of a specific plant disease, nutrient deficiency or irrigation problem. Field observations and agronomic context remain important when interpreting multispectral results.
What Is NDRE?
NDRE stands for Normalized Difference Red Edge Index.
Its formula is:
NDRE = (NIR – Red Edge) / (NIR + Red Edge)
Unlike NDVI, NDRE uses the Red Edge band instead of the conventional Red band.
The Red Edge wavelength is particularly useful for evaluating vegetation containing moderate to high levels of chlorophyll.
NDRE can therefore complement NDVI in:
- Dense crop canopies
- Mid- and late-season crops
- Chlorophyll variability analysis
- Nitrogen-management studies
- Crop stress monitoring
NDVI vs NDRE: Which Should You Use?
| Index | Bands Used | Common Application |
|---|---|---|
| NDVI | NIR + Red | General vegetation vigor and canopy density |
| NDRE | NIR + Red Edge | Chlorophyll response and denser vegetation |
| GNDVI | NIR + Green | Green-band vegetation and chlorophyll response |
| SAVI | NIR + Red + soil factor | Sparse vegetation with visible soil |
| OSAVI | NIR + Red | Vegetation analysis with reduced soil-background influence |
There is no single vegetation index that is optimal for every agricultural or environmental project.
A useful workflow is often to calculate several indices and compare them with field observations rather than relying exclusively on one map.
What Is GNDVI?
GNDVI stands for Green Normalized Difference Vegetation Index.
It replaces the Red band in NDVI with the Green band:
GNDVI = (NIR – Green) / (NIR + Green)
GNDVI can provide another perspective on vegetation response and chlorophyll-related variability.
If your sensor includes Green and NIR channels, the formula can be entered directly into Metashape’s Raster Calculator.
What Is SAVI?
SAVI, or Soil Adjusted Vegetation Index, was developed to reduce the influence of visible soil when vegetation cover is relatively sparse.
The formula is:
SAVI = ((NIR – Red) / (NIR + Red + L)) × (1 + L)
where L is a soil adjustment factor.
A commonly used value is:
L = 0.5
This can make SAVI useful where substantial soil is visible between plants and a conventional NDVI map is strongly influenced by soil background.
What Is OSAVI?
OSAVI stands for Optimized Soil Adjusted Vegetation Index.
It is related to SAVI but commonly uses a soil adjustment coefficient of 0.16:
OSAVI = (NIR – Red) / (NIR + Red + 0.16)
OSAVI can be useful when vegetation is relatively sparse or where soil brightness varies significantly across the field.
Step 1: Capture Multispectral Drone Imagery
Vegetation indices require the appropriate spectral bands.
A conventional RGB camera cannot generate a true NDVI because it does not normally capture a dedicated Near Infrared band.
Typical multispectral cameras used for vegetation mapping include sensors with combinations of:
- Blue
- Green
- Red
- Red Edge
- Near Infrared
- Panchromatic
Before flying, plan sufficient forward and side overlap and avoid rapidly changing illumination conditions whenever possible.
When quantitative comparisons are required, radiometric calibration should also be part of the image-acquisition workflow.
Step 2: Capture Reflectance Calibration Data
For supported multispectral sensors, Metashape Professional can use calibrated reflectance panels and sun-sensor information.
A calibrated reflectance panel provides a surface with known spectral reflectance values.
For sensors such as MicaSense RedEdge or Altum systems, panel photographs should be captured according to the manufacturer’s recommendations and imported together with the flight images.
Reflectance calibration is particularly important when:
- Comparing different fields
- Comparing flights from different dates
- Monitoring vegetation changes through a season
- Performing quantitative spectral analysis
Step 3: Import the Multispectral Images into Metashape
Create a new project in Agisoft Metashape Professional.
Select:
Workflow > Add Photos…
or, depending on the sensor workflow:
Workflow > Add Folder…
For synchronized multispectral sensors, choose:
Multi-camera system
Metashape can use image metadata to organize synchronized spectral bands into the corresponding camera groups.
Step 4: Check the Band Order
This is one of the most important steps before entering vegetation-index formulas.
Never assume that Band 1, Band 2, Band 3, Band 4 and Band 5 represent the same wavelengths for every multispectral sensor.
Open:
Tools > Camera Calibration
and inspect the:
Bands tab.
Verify which layer corresponds to:
- Blue
- Green
- Red
- Red Edge
- NIR
You should determine this order before entering any Raster Calculator formula.
Example: MicaSense RedEdge-P Band Order
After normal RedEdge-P multispectral processing, the common five-band output order is:
- Blue
- Green
- Red
- Red Edge
- NIR
In this specific case:
NDVI = (B5 – B3) / (B5 + B3)
and:
NDRE = (B5 – B4) / (B5 + B4)
Do not copy these band numbers to another camera unless you have verified that its layer order is identical.
Step 5: Calibrate Reflectance
If your dataset contains the required calibration information, open:
Tools > Calibrate Reflectance…
For reflectance-panel workflows, select:
Locate Panels
Metashape attempts to identify the calibration target automatically.
Then enter or load the calibrated panel reflectance values where required.
Depending on the sensor and available metadata, calibration can use:
- Reflectance panel data
- Sun sensor data
- Both sources
After calibration, continue with the normal photogrammetric processing workflow.
Step 6: Align Photos
Select:
Workflow > Align Photos…
Metashape determines camera positions and creates the initial tie point network.
After alignment, check that:
- The expected cameras are aligned.
- The complete survey area is reconstructed.
- No isolated camera groups are present.
- The coordinate reference system is correct.
Step 7: Build the DEM and Orthomosaic
Continue with the required photogrammetric processing steps.
Depending on your workflow, this can include:
Workflow > Build Point Cloud
followed by:
Workflow > Build DEM
and:
Workflow > Build Orthomosaic
The resulting orthomosaic contains the spectral information required for vegetation-index calculations.
Step 8: Open Raster Calculator in Metashape
After building the multispectral orthomosaic, select:
Tools > Set Raster Transform…
The Raster Calculator dialog allows you to define mathematical transformations using the available spectral bands.
Open the:
Transform tab.
Enter the required formula.
How to Calculate NDVI in Metashape
First identify which layers contain the NIR and Red bands.
The generic formula is:
(NIR – Red) / (NIR + Red)
For example, if your verified band order is:
- B3 = Red
- B5 = NIR
enter:
(B5 – B3) / (B5 + B3)
Enable the raster transform to display the calculated NDVI layer in Ortho view.
How to Calculate NDRE in Metashape
NDRE requires a dedicated Red Edge band.
The generic formula is:
(NIR – RedEdge) / (NIR + RedEdge)
If:
- B4 = Red Edge
- B5 = NIR
enter:
(B5 – B4) / (B5 + B4)
How to Calculate GNDVI in Metashape
The generic formula is:
(NIR – Green) / (NIR + Green)
For a dataset where:
- B2 = Green
- B5 = NIR
the formula becomes:
(B5 – B2) / (B5 + B2)
Step 9: Apply a Color Palette
A vegetation index is fundamentally a numerical raster.
To make spatial differences easier to visualize, open the:
Palette tab
inside Raster Calculator.
Choose an appropriate color ramp and adjust the minimum and maximum values according to the dataset.
A common visualization may use:
- Red or orange for relatively low index values
- Yellow for intermediate values
- Green for relatively high values
However, colors themselves have no universal biological meaning. They represent the numerical intervals you assign to the palette.
Do Not Use Universal NDVI Thresholds Blindly
It is tempting to interpret every NDVI map with fixed rules such as:
“0.8 means healthy and 0.4 means unhealthy.”
This can be misleading.
Vegetation-index values are influenced by factors including:
- Crop species
- Growth stage
- Canopy density
- Soil exposure
- Sensor characteristics
- Illumination
- Radiometric calibration
- Weather conditions
For many agricultural workflows, spatial differences within the same calibrated survey and changes over time are more informative than applying a universal threshold to every crop and field.
Step 10: Export the Vegetation Index Map
Select:
File > Export > Export Orthomosaic…
In the Raster Transform section, Metashape provides different export options.
None
Exports the original spectral bands and ignores the active Raster Transform formulas.
Index Value
Exports the numerical values produced by your vegetation-index formula.
This is normally the preferred option when the raster will be analyzed later in GIS or scientific software.
Index Colors
Exports an RGB visualization using the color palette configured in Raster Calculator.
This is useful for reports, presentations and quick visual interpretation.
GeoTIFF is typically the most convenient format when the map will be used in QGIS, ArcGIS or other geospatial software.
Export Numerical Data and Color Maps Separately
For professional workflows, consider exporting both:
- A numerical vegetation-index GeoTIFF
- A colorized visualization
The numerical raster preserves the actual calculated values for analysis.
The color image is primarily useful for visual communication.
Create Multiple Vegetation Indices from One Orthomosaic
Metashape’s Raster Calculator can accept more than one transformation formula.
This means the same calibrated multispectral orthomosaic can be used to generate multiple outputs without repeating the complete photogrammetric processing workflow.
For example, you can calculate:
- NDVI
- NDRE
- GNDVI
- SAVI or OSAVI
and compare how each index responds to the same field.
Creating Prescription Maps in Metashape
Metashape Professional can also use a calculated vegetation index as the basis for a prescription map.
After creating the NDVI or another appropriate raster transform, select:
Tools > Orthomosaic > Generate Prescription Map…
The transformed raster can be divided into management zones based on its histogram.
This provides a workflow for converting a continuous vegetation-index map into discrete spatial zones that can be exported for further agricultural analysis or management planning.
Any fertilizer or treatment decision should still be based on appropriate agronomic interpretation rather than vegetation-index values alone.
NDVI vs NDRE for Dense Crops
NDVI can become less sensitive when vegetation cover becomes very dense because the Red band is strongly absorbed by healthy vegetation.
NDRE uses the Red Edge band, which can retain greater sensitivity under denser canopy conditions.
For this reason, NDVI can be particularly useful for early and intermediate vegetation development, while NDRE can provide complementary information later in the season or in dense crops.
Using both can often provide more information than selecting one index exclusively.
Common Vegetation Index Mapping Mistakes
Using the Wrong Band Numbers
This is one of the easiest ways to generate a completely incorrect map.
Always verify the band order in Camera Calibration before entering a formula.
Skipping Reflectance Calibration
Uncalibrated imagery can still create a visually attractive vegetation map, but quantitative comparisons between flights become less reliable.
Comparing Flights with Different Processing Methods
If you are monitoring a crop through time, maintain a consistent acquisition and processing workflow.
Assuming Green Always Means Healthy
The colors are simply a visualization of numerical intervals configured in the palette.
Treating NDVI as a Diagnosis
A low vegetation-index value identifies spectral variability. It does not by itself prove whether the cause is disease, lack of water, nitrogen deficiency, soil conditions or another factor.
Recommended Metashape Vegetation Index Workflow
- Capture multispectral drone imagery with adequate overlap.
- Capture reflectance calibration data where appropriate.
- Import all spectral bands as a multi-camera system.
- Verify the correct band order.
- Perform reflectance calibration.
- Align the multispectral images.
- Optimize cameras and georeferencing if required.
- Build the DEM.
- Build the multispectral orthomosaic.
- Open Tools > Set Raster Transform.
- Enter the required vegetation-index formula.
- Configure an appropriate visualization palette.
- Compare NDVI, NDRE or other indices where useful.
- Export numerical index values as GeoTIFF.
- Optionally export a colorized version for visualization.
- Validate spectral patterns using field observations.
Final Recommendations
Creating NDVI and NDRE maps in Agisoft Metashape is straightforward once a correctly calibrated multispectral orthomosaic has been generated.
The most important rules are:
- Use a sensor containing the spectral bands required by the selected index.
- Verify the band order before entering formulas.
- Perform reflectance calibration when quantitative comparisons are required.
- Use symbolic band relationships rather than blindly copying band numbers.
- Export numerical index values when further analysis is required.
- Use color palettes primarily for visualization.
- Do not interpret vegetation indices without field or agronomic context.
With these steps, Agisoft Metashape Professional can provide a complete workflow from raw multispectral drone photographs to calibrated NDVI, NDRE and other vegetation-index maps suitable for precision agriculture, forestry, research and environmental monitoring.
Frequently Asked Questions
Can Agisoft Metashape calculate NDVI?
Yes. Metashape Professional can calculate NDVI and other vegetation indices from multispectral imagery using Tools > Set Raster Transform and the built-in Raster Calculator.
What is the NDVI formula?
The standard NDVI formula is (NIR – Red) / (NIR + Red).
What is the NDRE formula?
NDRE is calculated as (NIR – Red Edge) / (NIR + Red Edge).
Which is better, NDVI or NDRE?
Neither is universally better. NDVI is widely used for general vegetation and biomass variability, while NDRE can provide useful additional sensitivity to chlorophyll variation and denser vegetation canopies.
Can I calculate GNDVI in Metashape?
Yes. If Green and NIR bands are present, GNDVI can be calculated using (NIR – Green) / (NIR + Green).
Do I need a multispectral camera to calculate NDVI?
A true NDVI requires a Near Infrared measurement together with a Red measurement. A conventional RGB-only camera normally does not provide the dedicated NIR information required for standard NDVI.
Should I calibrate reflectance before creating NDVI?
Reflectance calibration is strongly recommended when vegetation-index values need to be compared quantitatively between locations or survey dates.
Can I export NDVI from Metashape to QGIS?
Yes. Export the transformed orthomosaic as a georeferenced raster such as GeoTIFF using the Index Value option for numerical values.
Can Metashape create agricultural prescription maps?
Yes. Metashape Professional includes a Generate Prescription Map tool that can use an active vegetation-index raster transform to divide the surveyed area into management zones.