

 Italiano
 Français
 Deutsch
 Español
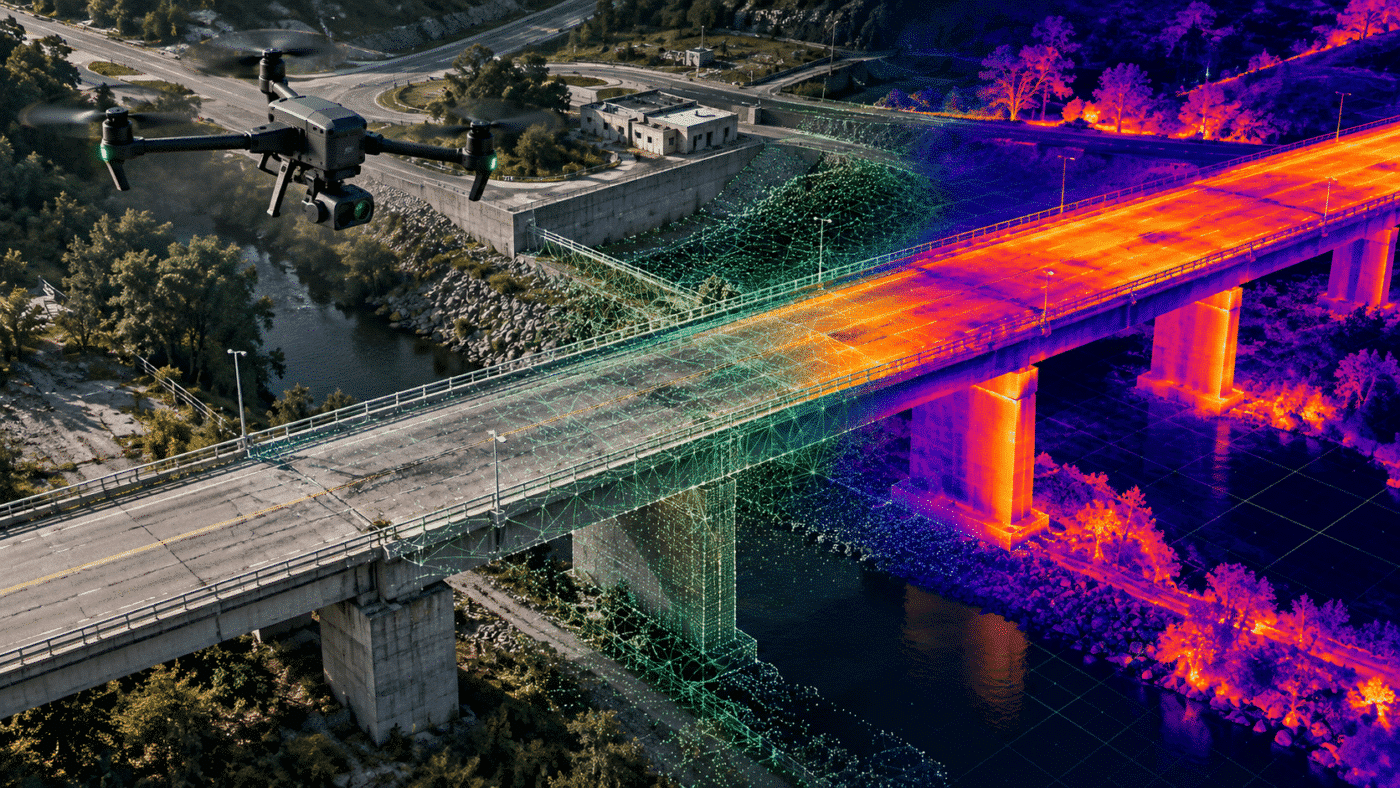
Thermal drone mapping with Agisoft Metashape can transform hundreds or thousands of aerial RGB and infrared images into spatially coherent products: an RGB orthomosaic, a radiometric thermal orthomosaic, a digital surface model, a 3D model and georeferenced layers for inspection or GIS analysis. The difficult part is not simply stitching colorful thermograms. A defensible workflow must preserve geometry, temperature information and the physical context in which the images were acquired.
RGB and thermal cameras observe the same scene in fundamentally different ways. RGB imagery normally provides higher spatial resolution and stronger visual texture for photogrammetric alignment. A radiometric thermal camera measures infrared radiation and can associate image pixels with apparent temperature values, but its images are often smaller, less textured and more sensitive to acquisition time, surface emissivity, reflections and environmental conditions. Combining both sources correctly allows RGB data to support geometry and interpretation while infrared data reveals spatial temperature patterns.
Key principle: use RGB imagery to build the strongest possible geometric framework, preserve the original radiometric thermal values, and validate spatial alignment and temperature behaviour independently. A visually attractive thermal map is not automatically a metrically or radiometrically reliable result.
This guide presents a complete professional workflow for processing RGB and infrared drone images in Agisoft Metashape Professional. Menu names refer to the current Metashape Professional 2.3 workflow; exact options may differ slightly between builds and camera systems.
Contents
- What thermal drone mapping actually produces
- RGB versus radiometric thermal imagery
- Mission planning for RGB and infrared surveys
- Preparing and checking the dataset
- Choosing a synchronized or separate-flight workflow
- Workflow A: synchronized RGB and thermal cameras
- Workflow B: RGB and thermal images from separate flights
- Radiometric values, palettes and temperature conversion
- Quality control and troubleshooting
- Recommended deliverables
- Frequently asked questions
What Is Thermal Drone Mapping?
Thermal drone mapping is the creation of a spatially referenced representation of surface temperature patterns from overlapping infrared images captured by an unmanned aircraft. Depending on the sensor and workflow, the final raster may contain calibrated or apparent temperature values, raw digital numbers, or only display colors. These outputs are not interchangeable.
A thermal orthomosaic corrects image perspective and projects infrared information onto a surface model. This makes it possible to compare locations, delineate anomalies and integrate results with CAD or GIS layers. Typical applications include:
- solar-module and electrical-infrastructure inspection;
- roof, façade and building-envelope surveys;
- district-heating and pipeline screening;
- industrial plant inspection;
- bridge-deck and concrete-infrastructure assessment;
- irrigation, crop-water stress and environmental monitoring;
- landfill, fire, geothermal and heat-loss investigations.
Thermal anomalies are indicators that require interpretation. A hot or cold area may be produced by a defect, but it can also result from shade, moisture, different materials, surface contamination, reflection, changing weather or a different viewing angle. For example, the U.S. Federal Highway Administration describes infrared thermography as a non-destructive method for detecting temperature patterns associated with bridge-deck delamination, while also emphasizing the importance of acquisition conditions and surface state. Its technical overview of infrared thermography for bridge inspection is a useful reference for understanding both the possibilities and limitations of the method.
RGB Images, Infrared Images and Radiometric Data
In this article, infrared means thermal infrared, usually long-wave infrared (LWIR). It should not be confused with the near-infrared band used by many multispectral agricultural cameras. Near-infrared measures reflected solar energy; thermal infrared records emitted radiation related to surface temperature.
| Property | RGB imagery | Radiometric thermal imagery |
|---|---|---|
| Primary information | Visible color and texture | Infrared radiation and apparent temperature |
| Typical spatial resolution | Relatively high | Usually much lower |
| Feature matching | Often strong on textured surfaces | Can be weak on uniform-temperature surfaces |
| Main photogrammetric role | Alignment, geometry, DSM or mesh, visual interpretation | Temperature-pattern mapping and anomaly analysis |
| Main measurement risks | Blur, exposure, calibration and georeferencing errors | All geometric risks plus emissivity, reflections, atmosphere and thermal drift |
A thermal JPEG displayed with an Iron, Rainbow or White Hot palette may look informative but contain only rendered colors. By contrast, a radiometric file retains per-pixel measurement information that can be converted or corrected according to the camera manufacturer’s model. Always establish what the files contain before processing. File extension alone is not sufficient: two images ending in .jpg may store completely different radiometric metadata.
Mission Planning for a Reliable Thermal Survey
The quality of a thermal map is determined largely before Metashape is opened. A processing workflow cannot reconstruct spatial detail that the thermal detector never captured, recover missing overlap or remove all environmental ambiguity.
1. Define the inspection question first
Write down the smallest anomaly that must be detected, the acceptable positional uncertainty, whether absolute temperature is required and what decision will be made from the result. Mapping relative hot and cold patterns is a different task from reporting an absolute surface temperature to a specified uncertainty.
For quantitative work, document the sensor model, calibration status, temperature range, emissivity assumption, reflected apparent temperature, atmospheric temperature, relative humidity, camera-to-target distance, wind, cloud cover and acquisition time. The relevant parameters vary by camera and application, so follow the manufacturer’s radiometric guidance.
2. Calculate thermal GSD, not only RGB GSD
Ground Sampling Distance must be calculated separately for each sensor. For a near-nadir image over approximately level terrain:
GSD ≈ (distance to target × sensor width) ÷ (focal length × image width)
The equivalent pixel-pitch form is:
GSD ≈ distance to target × pixel pitch ÷ focal length
Consider a thermal camera with a 12 µm pixel pitch and a 13.5 mm focal length. At a 50 m distance from the target, its approximate thermal GSD is 4.4 cm/pixel. At 100 m it becomes approximately 8.9 cm/pixel. These values describe sampling distance, not positional accuracy or minimum detectable defect size. The figures use specifications published for the DJI Zenmuse H30T radiometric thermal camera purely as an example.
A high-resolution RGB camera on the same payload can have a much smaller GSD. Exporting the final thermal orthomosaic at the RGB pixel size does not create additional thermal detail; it only resamples the lower-resolution measurements. For a complete explanation, see our guide to Ground Sampling Distance in drone survey planning.
3. Use sufficient overlap and robust camera geometry
Agisoft’s general aerial-capture guidance uses approximately 80% forward and 60% side overlap as a baseline for conventional imagery. Thermal datasets often benefit from greater redundancy because their resolution and local texture are lower. A practical starting point for many thermal mapping missions is around 85% forward overlap and 75–80% side overlap, provided flight speed and image interval still produce sharp, valid frames.
These percentages are not universal specifications. Large uniform roofs, water, vegetation, reflective materials and scenes with repeating patterns may remain difficult even with high overlap. A cross-grid can strengthen block geometry, while oblique images may be necessary for façades, bridge elements and complex industrial structures. Review our detailed guide to frontlap and sidelap for Agisoft Metashape when planning the mission.
4. Keep acquisition conditions stable
Thermal scenes can change while the drone is flying. Passing clouds, solar loading, wind, moisture, HVAC cycles and moving shadows may alter surface temperature faster than the mission can be completed. This creates real differences between overlapping images that no seamline algorithm can fully remove.
- Choose the time window according to the physical phenomenon being investigated.
- Avoid rain, wet surfaces and rapidly changing cloud conditions unless moisture response is the subject of the survey.
- Allow the thermal sensor to stabilize according to manufacturer instructions.
- Use flat-field correction as specified for the payload and record when corrections occur.
- Keep camera range, gain mode and radiometric settings consistent where possible.
- Reduce flight speed if necessary to protect image sharpness and overlap.
- Capture ground reference measurements when absolute temperature matters.
5. Design georeferencing for both spectra
RTK or PPK camera positions can improve georeferencing, but they do not eliminate the need for independent validation. Use surveyed checkpoints whenever project accuracy matters. If RGB and thermal cameras are physically separated, boresight and lever-arm offsets can create visible displacement, especially at close range or over surfaces with large elevation differences.
Standard painted ground targets may be obvious in RGB images but nearly invisible in thermal frames. Thermal control targets need sufficient infrared contrast with their surroundings at the time of capture. Before the complete mission, verify that targets are identifiable in raw images from both sensors. Our guide to camera accuracy settings for GPS, RTK, PPK and GCP workflows explains why realistic reference accuracies are essential during bundle adjustment.
Prepare and Inspect the Dataset Before Processing
Never overwrite the camera originals. Create a read-only archive and process a verified working copy. A clear folder structure prevents pairing errors and makes the project auditable:
01_RGB_ORIGINAL02_THERMAL_ORIGINAL03_RADIOMETRIC_CONVERTED04_CALIBRATION_AND_REFERENCE05_GCP_AND_CHECKPOINTS06_METASHAPE_PROJECT07_EXPORTS
Before importing images, check:
- Image counts and whether every RGB exposure has the expected thermal partner.
- Capture timestamps, sequence order and missing frames.
- GNSS coordinates, altitude reference and coordinate system.
- Image dimensions, bit depth, band structure and camera metadata.
- Whether thermal values are radiometric, raw digital numbers or display colors.
- Whether any conversion process preserved temperature values without per-image normalization.
- Blurred, saturated, corrupted or flat-field-correction frames.
- Temperature consistency over stable reference surfaces.
Do not convert radiometric images to ordinary 8-bit JPEG merely to make them easier to open. If conversion is required, use a manufacturer-supported tool or SDK and export a format that preserves the quantitative values, scale factor, offset, NoData definition and coordinate metadata needed later.
Choose the Correct RGB and Infrared Processing Strategy
| Dataset type | Recommended structure | Main advantage | Main risk |
|---|---|---|---|
| Synchronized RGB and thermal sensors in a rigid payload | One multi-camera system in a single chunk | Shared camera stations and estimable sensor relationship | Incorrect pairing or sensor offset |
| RGB and thermal images captured on separate flights | Separate chunks, aligned into one reference framework | Independent control of each dataset | Scene change and weaker cross-spectral registration |
| Single thermal-only mission | One thermal chunk | Simpler data management | Weak tie points and low-detail geometry |
The Agisoft Metashape Professional 2.3 User Manual confirms support for RGB, thermal and multispectral imagery, including multi-camera systems. It also documents thermal inputs such as AscTec ARA, WIRIS TIFF and R-JPEG containing FLIR data. This does not mean that every manufacturer’s R-JPEG variant is decoded identically. Confirm compatibility with your exact sensor and current Metashape build before starting a production project.
Workflow A: Synchronized RGB and Thermal Cameras
This is usually the most efficient approach when RGB and thermal sensors are rigidly mounted, triggered together and provide paired files for every camera station.
Step 1: Arrange paired images correctly
Place files from each sensor in a separate subfolder under one parent folder. The folders should contain the same number of images in corresponding capture order. Avoid renaming or sorting files in a way that breaks the relationship between RGB and thermal exposures.
Step 2: Import as a multi-camera system
- Open Metashape Professional and create a new project.
- Save the project in
.psxformat before heavy processing. - Choose Workflow > Add Folder.
- Select the parent folder containing the sensor subfolders.
- Choose Multi-camera system and create one sensor from each subfolder.
- Verify that every camera station contains the expected RGB and thermal image.
For supported multisensor cameras whose metadata is recognized, Metashape may organize the bands automatically. The official MicaSense workflow for processing sensor data in Agisoft Metashape is a useful example of metadata-driven multi-camera organization.
Step 3: Choose the master sensor or primary channel
Use the sharpest and most detailed channel as the basis for photogrammetric processing. In a conventional RGB-plus-thermal payload, that will normally be the RGB or panchromatic sensor rather than the low-resolution LWIR channel. Agisoft recommends selecting a primary channel that is sharp and rich in detail. MicaSense similarly recommends its panchromatic band as the primary channel for supported Altum-PT and RedEdge-P processing.
Open Tools > Camera Calibration and verify:
- the number and identity of sensors;
- image dimensions and pixel size;
- focal length and calibration groups;
- which sensor is configured as master;
- slave-sensor location and rotation offsets;
- whether adjustment of offsets is appropriate for the dataset.
If factory-calibrated lever-arm or boresight values are available, enter them with realistic accuracies. If the offsets are estimated during alignment, inspect their stability after optimization. A physically rigid camera rig should not produce wildly varying relative sensor positions.
Step 4: Align the imagery
Choose Workflow > Align Photos. High accuracy is a reasonable starting point for many inspection projects when hardware and dataset size permit. Generic preselection can accelerate matching; reference preselection can be useful when camera coordinates are trustworthy. Do not use excessively tight reference assumptions simply because RTK labels are present.
After alignment, inspect:
- the number and distribution of aligned camera stations;
- separate or weakly connected camera components;
- tie-point coverage across the complete site;
- camera residuals and systematic patterns;
- estimated sensor calibration;
- RGB-to-thermal displacement at recognizable boundaries.
Do not continue automatically because every camera is marked as aligned. An internally distorted block can still produce an attractive orthomosaic.
Step 5: Add control and optimize cameras
Import surveyed control points, assign the correct coordinate reference system and mark each point in multiple well-distributed RGB images. Where targets are visible thermally, verify their locations in the thermal images as well. Keep independent checkpoints disabled from optimization so they can measure external accuracy.
Run camera optimization using parameters appropriate to the camera model and block geometry. Review the change in checkpoint error, camera residuals and calibration coefficients. The lowest possible control-point error is not the only objective; a stable calibration and honest independent checkpoints are more important.
Step 6: Build geometry from the strongest source
Build the point cloud, mesh or digital elevation model primarily from the RGB-derived alignment and depth information. Thermal images generally contain less spatial detail and should not be expected to produce geometry equal to a high-resolution RGB camera.
- Use a DSM for terrain, roofs, bridge decks and approximately horizontal surfaces.
- Use a 3D mesh for façades, undersides, pipes, industrial assets and complex structures.
- Avoid using a bare-earth DTM to orthorectify temperatures measured on buildings, vegetation or equipment.
Step 7: Build and inspect the thermal orthomosaic
Choose the relevant thermal band or sensor, select the correct projection surface and build the orthomosaic. Inspect seamlines at high-contrast thermal boundaries. Temperature changes between flight lines may appear as stripes or patches; these are often acquisition effects rather than geometric errors.
Blending improves visual continuity but may modify extreme pixel values around seams. If maximum or minimum temperature is operationally important, retain the original radiometric frames and compare hotspot values against them. A thermal orthomosaic is a spatial synthesis, not a replacement for source-image evidence.
Workflow B: RGB and Thermal Images from Separate Flights
Separate flights are common when different drones or payloads are used. They require more control because camera positions are not paired and the scene may change between missions.
Step 1: Process the RGB block independently
Create an RGB chunk, align the images, add control, optimize the cameras and build the best available DSM or 3D model. Treat this as the geometric reference for the project. Validate it with independent checkpoints before using it to support the thermal product.
Step 2: Process the thermal block independently
Create a separate thermal chunk and import the original supported radiometric files or correctly converted images. Align the thermal set using its own metadata, sufficient overlap and appropriate preselection. Low contrast may result in unaligned cameras or weak areas; increasing key-point limits cannot compensate for a scene containing no stable, distinguishable features.
Step 3: Establish a common reference
Use the same coordinate system, surveyed markers and independent checkpoints in both chunks. If direct thermal target visibility is poor, use features that are geometrically stable and identifiable in both spectra, or purpose-built thermal targets. Chunk alignment by markers or reference can then bring the datasets into the same project framework.
Automatic image-based matching between RGB and LWIR images may fail because the same object can look completely different across spectra. Do not force a visually plausible transformation without measurable control.
Step 4: Use the validated RGB surface
Where appropriate, import or duplicate the validated RGB-derived surface into the thermal workflow and use it for orthorectification. This can improve spatial detail compared with a surface reconstructed only from low-resolution thermal images. However, the thermal camera orientations must already be valid; a high-quality RGB DSM cannot repair incorrectly aligned thermal cameras.
Step 5: Measure co-registration error
Check displacement between RGB and thermal layers at multiple independent features across the site, including different elevations and image edges. A constant horizontal offset suggests a datum or lever-arm issue. A displacement that changes with height or position may indicate orientation, calibration, parallax or surface-model errors.
Radiometric Values, Palettes and Temperature Conversion
Metashape can display temperature values using pseudocolor palettes and can work with supported thermal formats. The palette is only a visualization layer. Changing from Iron to Rainbow does not change the underlying measurement, while exporting a rendered screenshot may permanently discard radiometric information.
Always determine:
- the unit stored in the source or converted raster;
- the scale and offset required to obtain temperature;
- whether the values represent calibrated temperature, apparent temperature or digital numbers;
- how emissivity and atmospheric parameters were applied;
- whether NoData and saturated pixels are identified;
- whether mosaicking and resampling alter the intended statistic.
Temperature conversion is sensor-specific. For example, MicaSense documents that the Altum thermal band output is stored in centi-Kelvin and provides the conversion:
Temperature (°C) = (pixel value ÷ 100) − 273.15
This formula must not be copied to unrelated sensors. Consult the manufacturer’s documentation for every camera. See MicaSense’s official guide to converting Altum thermal values to degrees Celsius.
For analysis, export a GeoTIFF with an appropriate bit depth—often 16-bit integer with documented scale/offset or 32-bit floating point—rather than an 8-bit colorized image. Export a separate styled map for communication. Keeping the analytical and presentation products separate prevents accidental measurement from palette colors.
Quality Control for a Thermal Orthomosaic
A professional thermal drone mapping report should evaluate three independent types of quality:
- Geometric quality: how accurately the RGB model and thermal raster are positioned.
- Co-registration quality: how closely thermal anomalies coincide with the corresponding RGB objects.
- Radiometric quality: how reliably pixel values represent the intended apparent or corrected temperature.
Recommended checks include:
- independent checkpoint RMSE and individual residuals;
- camera-position and orientation residual plots;
- thermal-to-RGB offsets at distributed check features;
- inspection of raw frames behind every critical anomaly;
- comparison with contact or calibrated reference measurements where appropriate;
- histograms and value ranges before and after export;
- seamline and flight-line pattern inspection;
- verification of coordinate system, vertical datum, units, scale and offset;
- documentation of weather and surface conditions.
Do not report thermal GSD as mapping accuracy. Do not report GCP residuals as independent accuracy when the same points were used to optimize the solution. Do not label every thermal anomaly as a defect without corroborating evidence.
Common problems and corrective actions
| Problem | Likely cause | Recommended action |
|---|---|---|
| Many thermal images do not align | Low texture, insufficient overlap, blur or incorrect metadata | Check raw frames and pairing; use stronger reference data; repeat acquisition if viewpoints are missing |
| Thermal layer is shifted from RGB | Sensor offset, timestamp mismatch, parallax or wrong coordinate system | Verify pairing, rig calibration, lever arm, boresight and shared checkpoints |
| Striping between flight lines | Changing solar loading, gain, flat-field correction or weather | Review acquisition log and source frames; avoid treating radiometric variation as a purely cosmetic seam issue |
| Temperature values are implausible | Wrong unit, scale, offset, emissivity or conversion | Return to original radiometric files and apply the exact manufacturer-specific conversion |
| Hotspots disappear in the mosaic | Resampling, blending or coarse thermal GSD | Inspect original frames; preserve native resolution; consider a maximum-value analytical product in GIS |
| False anomalies on metal, glass or water | Low emissivity and reflected radiation | Change viewing geometry, document material properties and confirm with another method |
| Building edges look doubled | Incorrect surface, poor camera orientation or parallax | Use an RGB-derived mesh or improved DSM and recheck thermal camera alignment |
Choosing a DSM, DTM or 3D Mesh for Thermal Projection
The projection surface must represent the surfaces whose temperatures were measured:
- DSM: appropriate for roofs, terrain, vegetation canopies and relatively horizontal infrastructure.
- DTM: appropriate only when the thermal observations refer to the bare terrain represented by the DTM.
- 3D mesh: preferred for façades, bridge components, industrial installations and assets with vertical or overhanging geometry.
A thermal orthomosaic projected onto the wrong surface may be locally displaced even when the overall georeferencing appears correct. For complex assets, use multiple orthoprojection planes or a textured 3D model rather than forcing every surface into a conventional top-down map.
Interpreting Thermal Anomalies Responsibly
Thermal mapping measures surface radiation patterns, not hidden defects directly. Interpretation requires knowledge of heat transfer, materials, operating state and environmental history.
Buildings and roofs
Possible indications include insulation discontinuities, moisture-related thermal behaviour, air leakage or active heat loss. Roof material, solar exposure, wind and internal HVAC conditions must be considered. Different roofing materials can display different apparent temperatures even when their physical temperature is similar.
Solar photovoltaic systems
Thermal anomalies can identify modules or cells that require closer inspection. Useful results depend on electrical load, irradiance, viewing angle and avoidance of solar reflections. The RGB layer helps identify the exact module and provides context for maintenance teams.
Concrete and bridge decks
Subsurface discontinuities can affect heating and cooling rates, creating surface contrasts under favourable conditions. Moisture, overlays, debris and acquisition time can produce misleading patterns. Thermal results should guide targeted inspection and be corroborated with appropriate engineering or non-destructive testing methods.
Agriculture and vegetation
Canopy temperature can contribute to water-stress and irrigation analysis, but thermal response also varies with species, growth stage, solar radiation, wind and canopy structure. Thermal imagery may be combined with multispectral indices, but reflectance calibration and thermal calibration remain different operations.
Recommended Deliverables for a Professional Project
A complete handover should preserve both source measurements and interpretive products:
- original RGB and radiometric thermal images;
- Metashape
.psxproject with processing report; - RGB orthomosaic;
- DSM, DTM or mesh used for thermal orthorectification;
- analytical thermal GeoTIFF with documented units, bit depth, scale and offset;
- colorized thermal map with legend, palette and fixed temperature range;
- RGB-and-thermal comparison layout;
- hotspot or anomaly polygons as GIS vectors;
- GCP and checkpoint report;
- acquisition log including environmental and radiometric parameters;
- limitations, uncertainty and recommended follow-up inspection.
The styled thermal map should never be the only archive. Keep the underlying numeric raster so thresholds, palettes and classifications can be changed without reprocessing or estimating temperatures from colors.
Practical Workflow Summary
- Define the inspection objective and required thermal sensitivity.
- Calculate RGB and thermal GSD independently.
- Plan adequate overlap, flight geometry and thermal acquisition timing.
- Capture radiometric originals and environmental reference information.
- Archive source files and verify image pairing, metadata, units and bit depth.
- Import synchronized sensors as a multi-camera system, or process separate flights in separate chunks.
- Use RGB or panchromatic imagery as the primary geometric source when appropriate.
- Georeference with realistic camera accuracies, control points and independent checkpoints.
- Build a DSM or mesh that represents the measured surfaces.
- Generate the thermal orthomosaic while preserving radiometric values.
- Validate geometry, RGB-to-thermal co-registration and temperature behaviour separately.
- Export analytical and visualization products as distinct deliverables.
Frequently Asked Questions
Can Agisoft Metashape process thermal drone images?
Yes. Metashape Professional supports thermal imagery and multi-camera systems. Compatibility with radiometric metadata depends on the exact camera and file format. The current manual explicitly mentions AscTec ARA, WIRIS TIFF and R-JPEG with FLIR data. Verify other manufacturer-specific formats before production use.
Should RGB and thermal images be processed in the same chunk?
Use one multi-camera chunk when the sensors are rigidly mounted, synchronized and correctly paired. Use separate chunks when RGB and thermal images come from different flights or cannot be paired reliably, then align both products through a shared coordinate system and control.
Which channel should be primary in Metashape?
Normally choose the sharpest, highest-resolution and most detailed channel—often RGB or panchromatic—as the primary source for alignment and geometry. Thermal imagery can remain associated with the camera system for orthomosaic generation and analysis.
Can an RGB orthomosaic and thermal orthomosaic have the same resolution?
They can be exported with the same pixel size, but this does not make their true spatial information equal. Thermal detail is limited by the detector, lens, flight distance, focus, motion and processing. Resampling a thermal raster to the RGB GSD creates more pixels, not more measured detail.
Does a thermal JPEG always contain temperature data?
No. It may contain radiometric measurements, manufacturer-specific metadata or only rendered colors. Confirm the format with the camera documentation and inspect metadata before processing.
Why does the thermal orthomosaic contain visible seams?
Seams may result from changing weather, solar loading, camera stabilization, flat-field correction, gain changes, viewing angle or actual scene-temperature changes. Blending can hide some seams visually but may also change extreme values, so investigate the source images first.
Can RTK eliminate the need for thermal ground control?
RTK improves camera positioning but does not validate camera calibration, sensor offset, vertical datum or RGB-to-thermal registration. Independent checkpoints remain the best way to quantify external positional performance.
Can a thermal orthomosaic prove that a structure is defective?
Not by itself. It identifies spatial thermal anomalies. Confirming the cause may require engineering assessment, repeat surveys, contact measurements or complementary non-destructive testing.
Final Recommendations
A reliable RGB and infrared workflow in Agisoft Metashape is built around three separate questions:
- Is the geometry accurate?
- Are the RGB and thermal layers correctly registered?
- Do the thermal values retain a documented physical meaning?
If any one of these questions cannot be answered, the result should be treated as exploratory rather than quantitative. Strong RGB geometry, correct multi-camera organization, realistic georeferencing, preserved radiometric data and independent validation turn a collection of thermograms into a defensible thermal mapping product.
For more technical workflows, visit the Drone Emotions Photogrammetry Knowledge Base and the upcoming Agisoft Metashape webinars. If you require the georeferencing, multispectral, orthomosaic and professional measurement tools described in this guide, view the Agisoft Metashape Professional Edition.
Technical and safety note: this guide describes a general photogrammetric workflow. Sensor configuration, thermographic measurement procedures, aviation requirements and inspection standards must be adapted to the equipment, jurisdiction and application. Thermal anomalies should be interpreted by appropriately qualified professionals.