Agisoft Viewer is a lightweight, free application developed by Agisoft that allows users to view, explore, and analyze 3D models, orthomosaics, and digital elevation data created in Agisoft Metashape Professional. Among its most valuable features are the Measure and Drawing tools, which enable users to interact with spatial data, perform basic analysis, and make annotations without needing the full Metashape software.
Whether you’re a surveyor, engineer, archaeologist, or GIS analyst, mastering these tools helps you extract valuable information from photogrammetric projects efficiently. This guide explains how to use the Measure and Drawing tools in Agisoft Viewer, with practical examples, tips, and best practices.
What Is Agisoft Viewer and Why Use It?
Agisoft Viewer is designed as a companion application for Metashape. It allows users to open and inspect Metashape projects in a simplified, read-only format. This makes it ideal for data sharing and field verification, as it requires minimal system resources while providing full visualization capabilities for large 3D datasets.
Key advantages of Agisoft Viewer include:
- Free and lightweight — no license required.
- Supports large 3D models, point clouds, and orthomosaics.
- Ideal for client presentations, inspections, and data review.
- Includes built-in measurement and annotation tools for analysis and communication.
While it doesn’t offer the full processing capabilities of Metashape, the Viewer excels as a visualization and measurement platform, enabling non-technical users to explore complex photogrammetric results easily.
Understanding the Measure and Drawing Tools
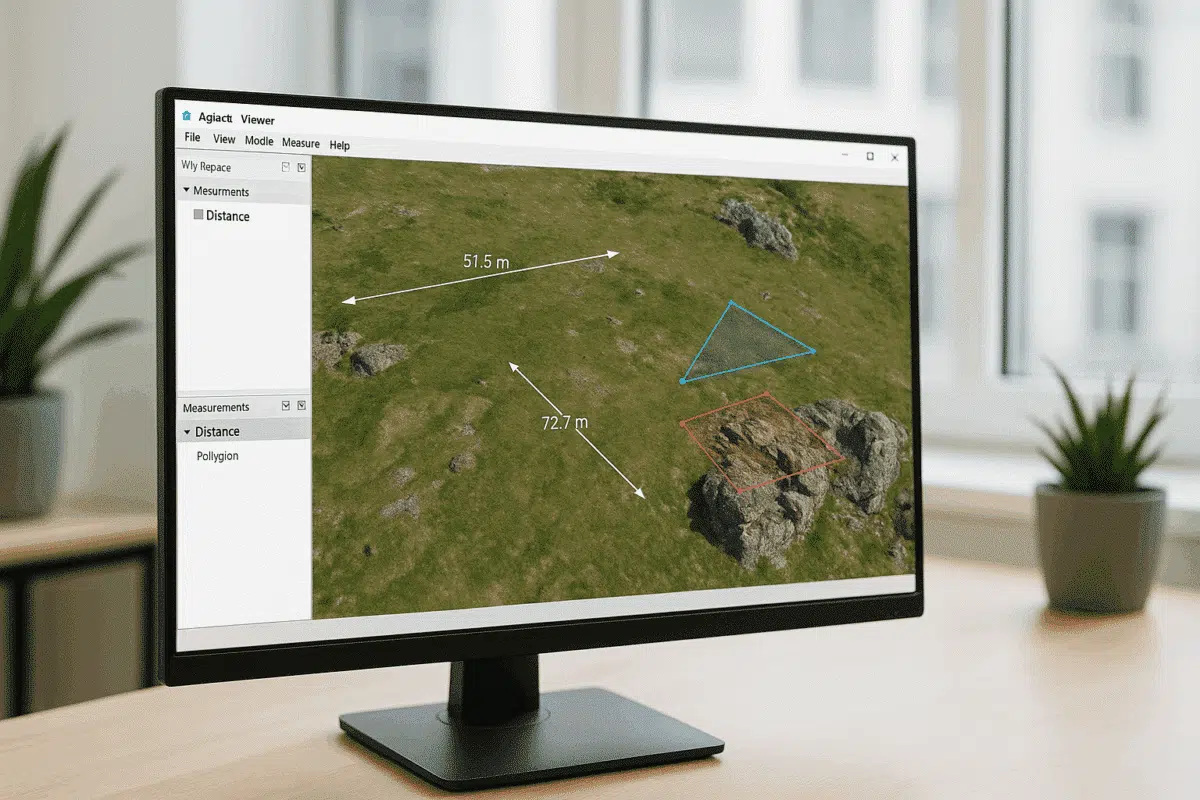
The Measure and Drawing tools in Agisoft Viewer are designed to provide users with intuitive ways to extract geometric and spatial information from 3D models or orthomosaics. These tools are found in the toolbar and can be used interactively in both 2D and 3D views.
Available Measurement Tools
Agisoft Viewer offers several types of measurements:
- Distance: Measures straight-line distances between two or more points in 3D space.
- Area: Calculates the surface area within a user-defined polygon.
- Elevation Profile: Measures height differences between points or along paths.
- Coordinate Reading: Displays X, Y, Z coordinates for any selected point on the model.
These measurements can be saved, exported, or used to create annotations that remain visible in subsequent viewing sessions.
Drawing Tools Overview
In addition to direct measurements, Agisoft Viewer includes basic drawing tools for adding vector-based annotations such as lines, polygons, and markers. These elements can represent infrastructure, features of interest, or measurement areas, and are particularly useful for collaboration and communication with clients or teams.
- Point Marker: Place single points of interest with coordinate information.
- Polyline: Draw connected line segments to define paths, cables, or boundaries.
- Polygon: Draw closed shapes to define zones, plots, or surface areas.
All drawn elements can be assigned labels, colors, and layer names for easy organization within the project.
How to Use the Measure Tool in Agisoft Viewer
To perform accurate measurements in Agisoft Viewer, follow these step-by-step instructions:
Step 1: Load a Project or Model
Open Agisoft Viewer and load your file via File > Open Project. You can import:
- Agisoft project files (
.psx) - 3D model files (
.obj,.ply,.fbx) - Orthomosaics or DEMs (
.tif)
Once loaded, you can navigate freely using the mouse to zoom, pan, and rotate your dataset.
Step 2: Activate the Measurement Tool
Click the Measure icon in the toolbar and select the desired mode — for example, Distance or Area. The cursor will change, allowing you to select points directly on the model or image surface.
Step 3: Take Measurements
Click on the surface to start measuring. For distance measurements, each click defines a new segment. The Viewer automatically calculates the total length and displays it in real-time in the measurement panel.
For area measurements, click multiple points to define the polygon boundary. Double-click to close the shape, and the calculated area will appear in the results window, along with perimeter and coordinate information.
Step 4: Save or Export Results
Once you’ve taken measurements, you can:
- Save them within the Viewer project for later review.
- Export them as
.txtor.csvfiles for analysis in Excel or GIS applications. - Screenshot the results using File > Export View for reporting or documentation.
All measurements are accurate to the project’s coordinate system, provided the model has been georeferenced in Metashape.
Using the Drawing Tools
The Drawing tools are ideal for annotation, planning, and communication. They allow users to mark features or boundaries directly on the 3D surface.
Creating Annotations
To draw an annotation:
- Select the Drawing Tool icon from the toolbar.
- Choose between Point, Polyline, or Polygon.
- Click to place points on the model. For polygons, double-click to close the shape.
You can customize the color, thickness, and name of each annotation using the Properties panel. Labels appear automatically and can be adjusted for readability.
Editing and Managing Drawings
All drawings are listed in the Layers or Objects panel, allowing you to toggle visibility or delete unwanted elements. You can also edit individual vertices by selecting and dragging them directly on the model.
Drawings can be exported in vector formats such as .DXF or .SHP, making them compatible with CAD or GIS software for further analysis or integration.
Applications of Measure and Drawing Tools
The measurement and drawing capabilities in Agisoft Viewer open up numerous practical applications across industries:
- Surveying & Mapping: Measure distances, areas, and elevations directly from drone surveys.
- Architecture & Engineering: Annotate structures, boundaries, or utilities for design validation.
- Environmental Monitoring: Outline vegetation zones, erosion areas, or flood boundaries.
- Archaeology & Heritage: Mark excavation sites and measure artifact dimensions on 3D models.
- Infrastructure Inspection: Measure cracks, distances, or powerline clearances on reconstructed assets.
Because Agisoft Viewer is lightweight, these tasks can be performed even on laptops or tablets in the field, improving efficiency for site verification or client demonstrations.
Tips for Accurate Measurements
- Always verify that your dataset is properly georeferenced before taking measurements.
- Zoom in closely when selecting points to avoid pixel-level inaccuracies.
- For sloped surfaces, use the 3D model view rather than orthographic view to ensure true spatial distances.
- When working on large datasets, disable unnecessary layers to improve performance.
- Use consistent units (meters, feet, etc.) across all projects for clarity and data compatibility.
Advantages of Working in Agisoft Viewer
Unlike heavy GIS or CAD software, Agisoft Viewer offers an intuitive, portable environment focused on visualization and measurement. Its native compatibility with Metashape project files ensures that metadata, coordinate systems, and color information are preserved. This makes it an ideal tool for reviewing models, validating results, or sharing data with clients who don’t own Metashape licenses.
Conclusion: Efficient 3D Measurement and Annotation Made Simple
The Measure and Drawing tools in Agisoft Viewer empower users to extract actionable information from 3D models and orthomosaics effortlessly. Whether you’re measuring distances between structures, calculating surface areas, or annotating critical features, these tools offer a balance of precision and simplicity.
By integrating Agisoft Viewer into your photogrammetry workflow, you can share, analyze, and communicate results more effectively — without needing complex software or heavy processing power. It’s an essential companion for anyone working with 3D spatial data generated in Metashape.